Climate in Time and Space
In his article Academician N.L. Dobretsov develops the ideas discussed in the article by Academician V.I. Osipov “What Natural Disasters Are and How We Can Fight Them.” It touches upon such issues as heterogeneity (scatteredness) of natural disasters in space and time connected with climatic change and the phenomenon of periodic changes in the climate on the planet itself. This information is necessary for the understanding of the so-called phenomenon of “global warming” which has been constantly discussed in the media over the last decade
Global warming is defined as an increase in the average temperature of the surface layer of the atmosphere one degree over 100 years on average. A famous Russian oceanologist and climatologist A. S. Sarkisyan describes this phenomenon which is usually associated with the beginning of an era of rapid technical advances as follows: “Some scientists call this scary story constantly fed to the population “a global lie of the 20th century.” ‹…› What we deal with is a one-sided interpretation of global fluctuations in climatic characteristics which are cyclical in nature” (Sarkisyan, 2009, p. 161).
He also points out that in the observable history of the Earth periods of warming have always interchanged with cold spells attributed to astronomical factors but not only to them. The climate of the planet is influenced by oceanic “conveyor belt” of currents which depends on the location of high mountains and the continents themselves: relative movement of the continents results in changes in the configuration of oceanic currents, even though it takes millions of years.
. Based on these cycles the corresponding insolation variations on the Earth’s surface (A) are calculated on which the emission of the main greenhouse gases (methane and carbon oxide) with the periodicity of 22,000 and 41,000 years (B and C) is superimposed. Superimposition of these curves gives the resulting integral curve D (representing insolation variations + greenhouse gases effect) of global climate changes from the Glacial Age (G) to the interglacial epoch (IG). Global climate changes result in variation in the total amount of ice on the planet (E). It reaches its peak during glacial periods and is at its minimum during the interglacial epochs as is the case at present when the ice sheets have only been preserved in Greenland and Antarctica. Ice sheet dynamics has been used to calculate the variation in the level of the ocean (exemplified by the Coral Sea) as well as the content of the heavy oxygen 18O isotope in benthic and planktonic organisms in equilibrium with the sea water (a share of this isotope in water increases with the increase in the volume of ice). The actual data about 18O content received while studying the sea organisms support the calculated model very well, at least to the period of 130 thousand years ago (F). According to: (Ruddiman, 2003). Fluctuations in the volume of ice over the last 140,000 years are exemplified by the Karsk-Scandinavian (Euroasian) glacier which melted and grew very unevenly (on the right). According to: (Svendsen et al., 2004)")
One of the most significant factors in climate variation is associated with the changes in the nature and intensity of volcanism with the periodicity of up to tens of thousands of years. They result in enormous amounts of greenhouse gases (carbonic acid, methane, etc.) emitting into the atmosphere which exceed the waste from industrial enterprises and thermal power plants many times (Dobretsov, Kovalenko, 2001; Textor et al., 2004). According to A. S. Sarkisyan, “here there is a whole range factors of influence, and it would be wrong to reduce everything to an increase in the СО2 content in the atmosphere due to industrialisation” (2009, p. 162).
It will get warmer in some places but colder in some others
Heterogeneity of climate change on Earth over the last 150 years has most vividly manifested itself in different dynamics of temperature change in the Northern and Southern hemispheres. In the Arctic, for example, a distinct warming has been detected, while in the Antarctic a clear tendency to cooling has been observed except for its western part Antarctic peninsula), where a slight warming has been detected (Overlemd et al., 2008).
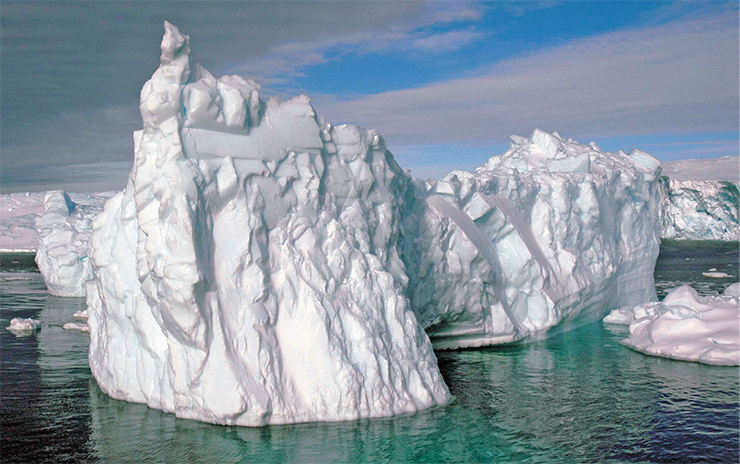
Another telling example of the influence the territorial factor has on climate change is heterogeneous melting of polar ice. It is known that over the last fifty years warming in the Arctic has resulted in the reduction of permanent (pack) ice almost twofold. This process has most drastically manifested itself in the zone of influence of the warm current Gulfstream; however, it is hardly noticeable in eastern Alaska, near the Baffin Island and in Northern Greenland, where the cold Drake Passage has strengthened.
. The area with the highest level of increase in photosynthetic activity over the last years is tight against the area of melting ice. Next to it is the zone of desertification where plant density is decreasing (at the bottom). According to: (Eos, 2007; Eos, 2008)")
It is probable that the main reason for heterogeneous temperature increase on the continents is connected with the World Ocean, where constant water circulation is engaged in slow heat transfer. In the Southern Hemisphere, mostly cold currents dominate compensating for the warming effect: taking away some excessive heat, they give it away along the current in the Northern polar zone.
It is important to note that it is impossible to evaluate the changes in climatic characteristics of the ocean on the whole by observing the temperature and speed of surface currents in the ocean only, because it requires making extremely complex calculations. For this reason, when processing field data it is possible to receive a qualitative picture at best (Sarkisyan, 2009).
Contrast “scatterredness” of climate change manifests itself in some other evident ways. In the streak adjoining the area with the intensive melting of arctic ice, a considerable increase in the plants’ photosynthetic activity has been detected; however, to the south large areas with severe desertification have become prominent.
Climatic swing
The data pertaining to Holocene (i.e., over the last 12,000 years) and historic time of the last 2,000–3,000 years are of utmost interest for the analysis of current climate change.
")
There are a great many methods to reconstruct the ancient climatic conditions. One of them is measuring the width of tree rings; another one is studying the isotopic content and amount of plant pollen in the kernels from polar and high-mountain glaciers, the composition of flora and fauna from lake and cave sediment, etc.
Comparing the results of different research studies, important conclusions can be drawn about the progress and nature of climatic changes over vast territories and considerable periods of time. All the accumulated data attest to the same: over the past millennia, both regional and global climate have seen considerable changes, with average annual temperature fluctuations in some regions reaching several degrees.
The results of chemical analysis of the sedimentary deposits in the Teletsk Lake were used to create a chart of average annual temperature fluctuations over a period of three thousand years (Kalugin et al., 2009). There is a visual similarity between a section of temperature profile over the last four centuries and a five-century interval with the center in the beginning of modern era (250 BC–250 AD) resulting from cyclical repetition of certain processes influencing the climate.
The results of correlation analysis support the hypothesis about the periodicity of the centuries-old temperature variation. That is why superimposing averaged curve of the Ancient Roman time on the modern period allows us to forecast the nature of climate change in the nearest century. The results of this extrapolation show that average annual peak in global temperature will be reached by the middle of the 21st century, after which steady climatic cooling is expected which will result in a new Ice Age.
")
The fact that quite a different amount of sulfur has been detected in the bottom sediment from Teletsk Lake dating from different but close years in high antiquity can hardly be attributed to the influence of technogenic factors. It is evident that the maximum level of concentration of sulfates reflects the periods of dustiness in the atmosphere from volcanic eruptions. It is also supported by the corresponding peaks in magnum and calcium content in glaciers of Mount Belukha located in the same region (Oliver et al., 2006).
An increase in the number of dust storms as a result of desertification in the Altai region of Russia and Mongolia also coincides with the maximum volcanic activity (Zykin, 2003). It is worth mentioning that the dust content in the air depends on precipitation. This is a very important climatic indicator connected with temperature, even though their dependence is ambiguous.
 sediment. According to: (Kalugin et al., 2009)")
To give you one example, fluctuations of the water level in Chany, the largest drainless lake in West Siberia, is predominantly determined by the amount of precipitation in the form of rain and snow. Periods of the main extrema of the level curve are in opposite phase with the temperature dynamics in Eurasian subarctic zone: years of high water in the lake approximately coincide with the temperature minima. At present, the level of the lake has dropped below its one thousand year minimum and keeps decreasing (Tarasov, 1995).
 are in the opposite phase with the temperature dynamics in Eurasian subarctic zone (b). The level of the lake in 1972 is taken as the reference level. According to: (Shnitnikov, 1982; Tarasov, 1995; Naurzbaev et al., 2003, etc.)") A large body of data accumulated about climate change from the ancient times to the present, several examples of which are discussed in this article, allow us to make two important conclusions.
A large body of data accumulated about climate change from the ancient times to the present, several examples of which are discussed in this article, allow us to make two important conclusions.
First, a notorious “scary story” about global warming is greatly exaggerated because it is probable that as soon as by the middle of the 21st century the global warming can turn into a global cooling. This forecast is not sufficiently accurate yet; however, in any case, the natural heat contribution to the climatic cycle is immeasurably greater than the technogenic one.
Second, for many regions a more important factor than the trends in global temperatures is local natural changes, which will allow predicting undesirable natural phenomena connected with the climate change in the macroregion.
In conclusion, it is worth mentioning how important orbital monitoring is for evaluating natural changes and imminent disasters. With the help of satellites it is possible to track snowfalls and snow depth, thus forecasting the level of flooding and possible mash flooding. Besides, considerable experience has been accumulated in registering fires with the help of satellite images. In addition, strategies for increasing the level of reliability in evaluating seasonal risk of fire in endangered regions have been developed.
Several of such research studies are being carried out in the institutes of SB RAS, namely, in the Institute for Water and Environmental Problems (Barnaul) and at the V. N. Sukachev Institute of Forest (Krasnoyarsk) as well as in some others.
References
Global’nye izmenenija prirodnoj sredy–2001 / Red. Dobrecov N. L., Kovalenko V. I. Novosibirsk: Izd-vo SO RAN, filial «Geo». 373 s.
Kalugin I. A., Dar’in A. V., Babich V. V. 3000-letnjaja rekonstrukcija srednegodovyh temperatur Altajskogo regiona po litologo-geohimicheskim indikatoram donnyh osadkov oz. Teleckoe // Dokl. RAN. 2009. T. 426, № 4. S. 520–522.
Kotljakov V. M. Proshloe i budushhee okruzhajushhej sredy – svidetel’stvuet gljaciologija // Nauka v Rossii, 2001. № 1. S. 107–111.
Malygina N. S., Papina T. S., Shvikovski M. Rekonstrukcija postuplenija oksidov sery v atmosferu po dannym lednikovogo kerna sedloviny g. Beluha // Led i sneg, 2010. № 2 (110). S. 29–34.
Matematicheskie modeli cirkuljacii v okeane: nauchnoe izdanie / G. I. Marchuk, V. . Kochergin, A. S. Sarkisjan i dr. Novosibirsk: Nauka, Sib. otd-nie, 1980.
Papina T. S., Malygina N. S., Mitrofanova E. Ju. Sravnenie rekonstrukcij izmenenija temperatury na Altae za poslednie 750 let po dannym g. Beluha i dannym osadkam Teleckogo ozera // Led i sneg, 2011. № 5 (113).
Sarkisjan A. S. Modelirovanie izmenenija klimaticheskih harakteristik okeanov // Nauka i chelovechestvo. XXI vek: Sb. M.: Fond «Znanie» im. S. I. Vavilova, 2009. Vyp. 1. 327 s.
Bradley R. S., Briffa K. R., Cole J., Hughes M. K., Osborn, T. J. The climate of the last millennium // Paleoclimate, Global Change and the Future / Alverson K. D., Bradley R. S., Pedersen T. F. (Eds.). Springer Verlag, Berlin, 2003. P. 105–141.
Olivier S., Blaser C., Brtsch S., Frolova N., Gggeler H. W., Henderson K. A., Palmer A. S., Papina T., Schwikowski M. Temporal variations of mineral dust, biogenic tracers and anthropogenic species during the past two centuries from Belukha ice core, Siberian Altai // J. Geophys. Res. Atmos. 2006. Vol. 111. D05309, doi:10.1029/2005JD005830.
Textor C., Graf H.-F., Timmreck C., Robock A. Emissions from volcanoes // Emissions of Atmospheric Trace Compounds, Series: Advances in Global Change Research, Vol. 18, Chapt. 7 / Cranier C., Artaxo P., Reeves C. (Eds.). Kluwer Academic Publishers, Dordrecht. P. 269—303.